A Geography of AI
An interactive map of the concepts, dependencies and foundations behind modern AI.
I often find myself moving between subjects while trying to understand something in modern AI. I might be revisiting some linear algebra, working through a statistics concept, reading an AI alignment paper or trying to understand a particular architecture. It wasn't always obvious how these topics fit together, particularly because different kinds of AI systems have different requirements and depend on different combinations of underlying ideas.
Most learning material presents these concepts separately. Linear algebra in one place, probability and statistics in another, learning methods somewhere else, followed by architectures, software libraries and models. These things don't really exist in isolation. A model depends on an architecture, which depends on learning methods and computational infrastructure, all of which draw on mathematical ideas and data.
I wanted something that would make those relationships easier to explore. Not another web of loosely connected nodes where every relationship is treated alike, but a structured representation of how modern AI is built, starting from the foundations. The connections needed direction, and the concepts needed to be organised into layers that distinguish foundations from the things built upon them.
So here is DSMAI (Dependency Structure of Modern AI).
The structure
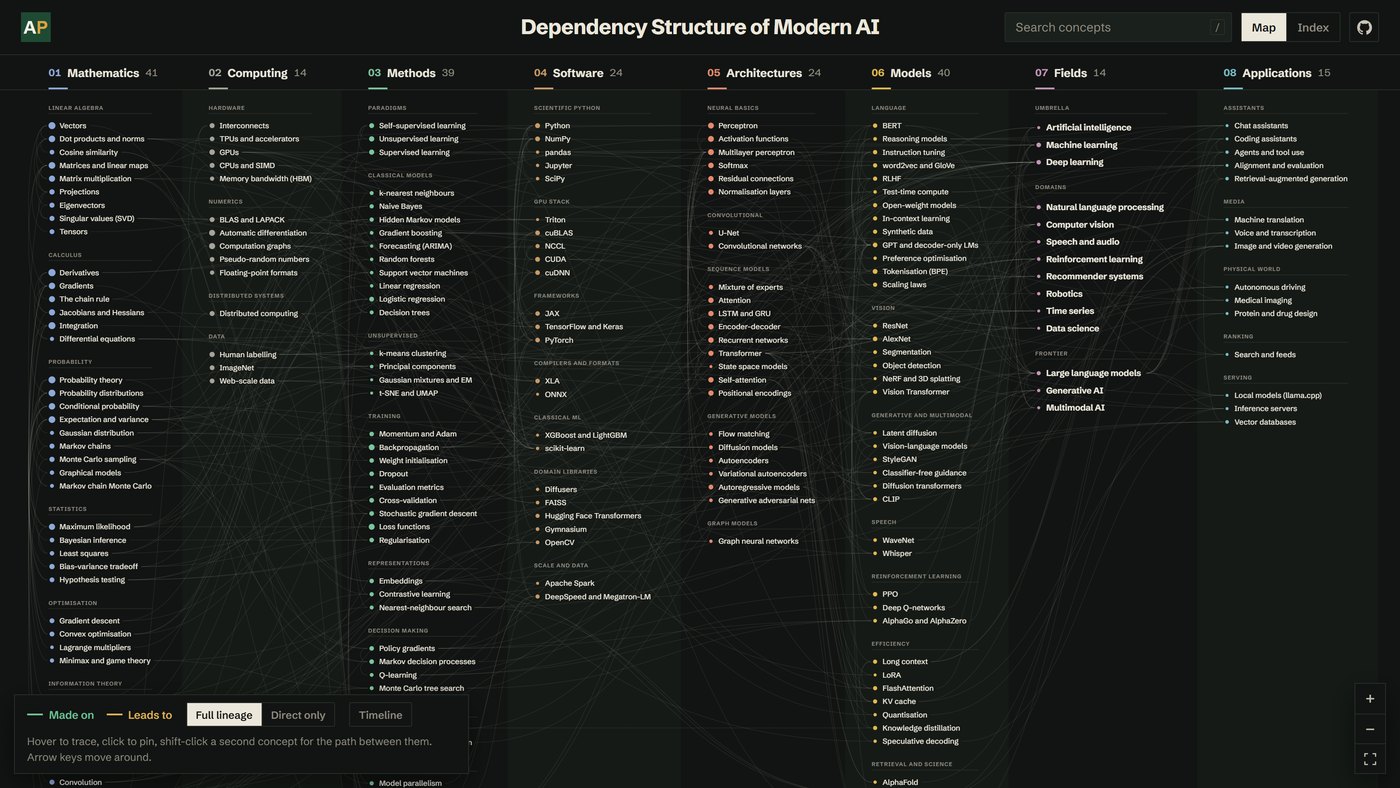
DSMAI organises concepts into eight layers, arranged from foundations to applications.
| Layer | Concepts | Count |
|---|---|---|
| Mathematics | Linear algebra, calculus, probability, statistics, optimisation, information theory | 41 |
| Computing | Hardware, numerical representations, computational techniques and data | 14 |
| Methods | Learning algorithms, training techniques, reinforcement learning and more | 39 |
| Software | NumPy, CUDA, PyTorch, JAX, Hugging Face and other tools | 24 |
| Architectures | Transformers, CNNs, RNNs, diffusion, VAEs, GANs and more | 24 |
| Models | GPT, BERT, ResNet, CLIP, AlphaZero, reasoning models and modern techniques | 40 |
| Fields | Machine learning, computer vision, NLP, reinforcement learning, generative AI and more | 14 |
| Applications | Chat assistants, RAG, agents, coding assistants, medical imaging and more | 15 |
The current map contains 211 concepts and 522 dependencies.
Each concept has a short description, its dependencies and, where applicable, an associated year and reference to a paper or project. The dependencies are directional, pointing from the foundations towards the concepts built upon them.
A concept can depend only on something in its own layer or an earlier one.
The layers provide an organisational structure for exploring the field. They aren't intended to prescribe a particular order of learning. There are multiple ways to approach a subject, and the point is to make its dependencies visible rather than turn them into a mandatory curriculum.
Using it
The main interaction is lineage tracing.
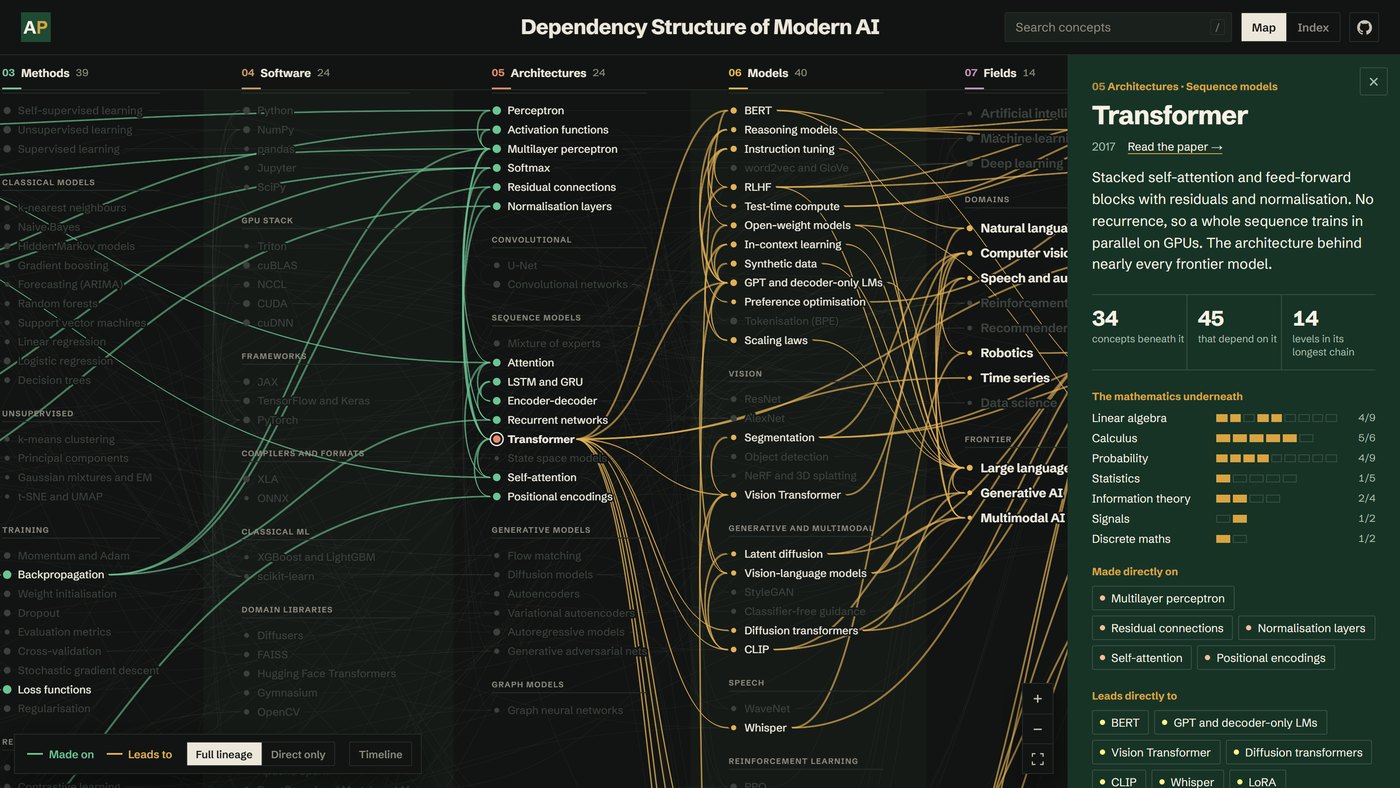
Hovering over a concept, or tapping it on a phone, highlights everything it rests on in green and everything built on top of it in ochre. Clicking pins the concept and opens a detail panel.
The detail panel contains its description, year and reference, along with its direct dependencies and dependents. It also shows how many concepts lie beneath and above it in the graph, the length of its longest dependency chain, and a breakdown of the mathematical foundations it ultimately depends on.
You can also explore the relationship between two concepts. Shift-clicking a second concept reveals all the dependency paths connecting them, grouped by layer.
For example, the current map shows 37 intermediate concepts connecting matrix multiplication to chat assistants, excluding the two selected concepts themselves. This lets you explore how something as fundamental as matrix multiplication connects, through several layers of abstractions and techniques, to an application people interact with every day.
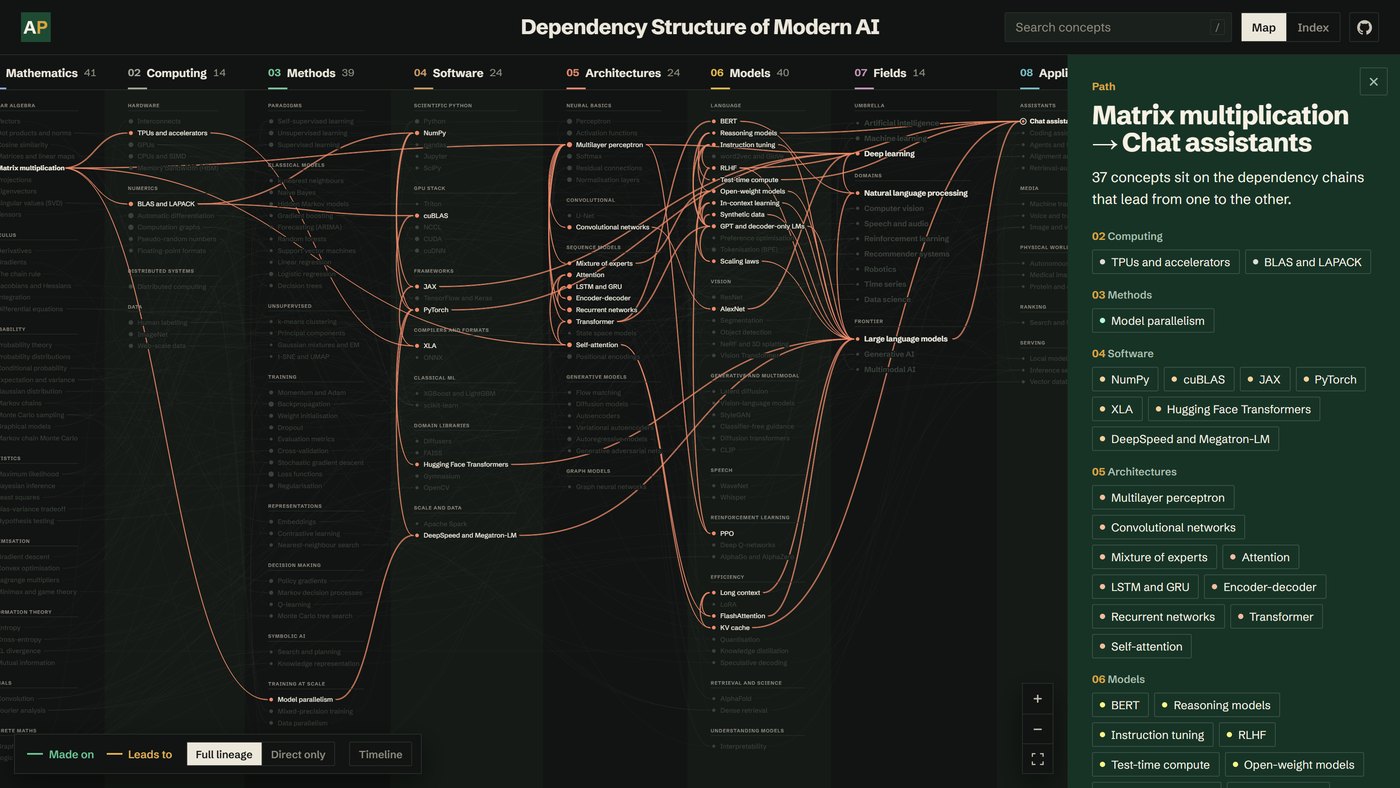
When neither concept builds on the other, the graph instead shows their shared foundations.
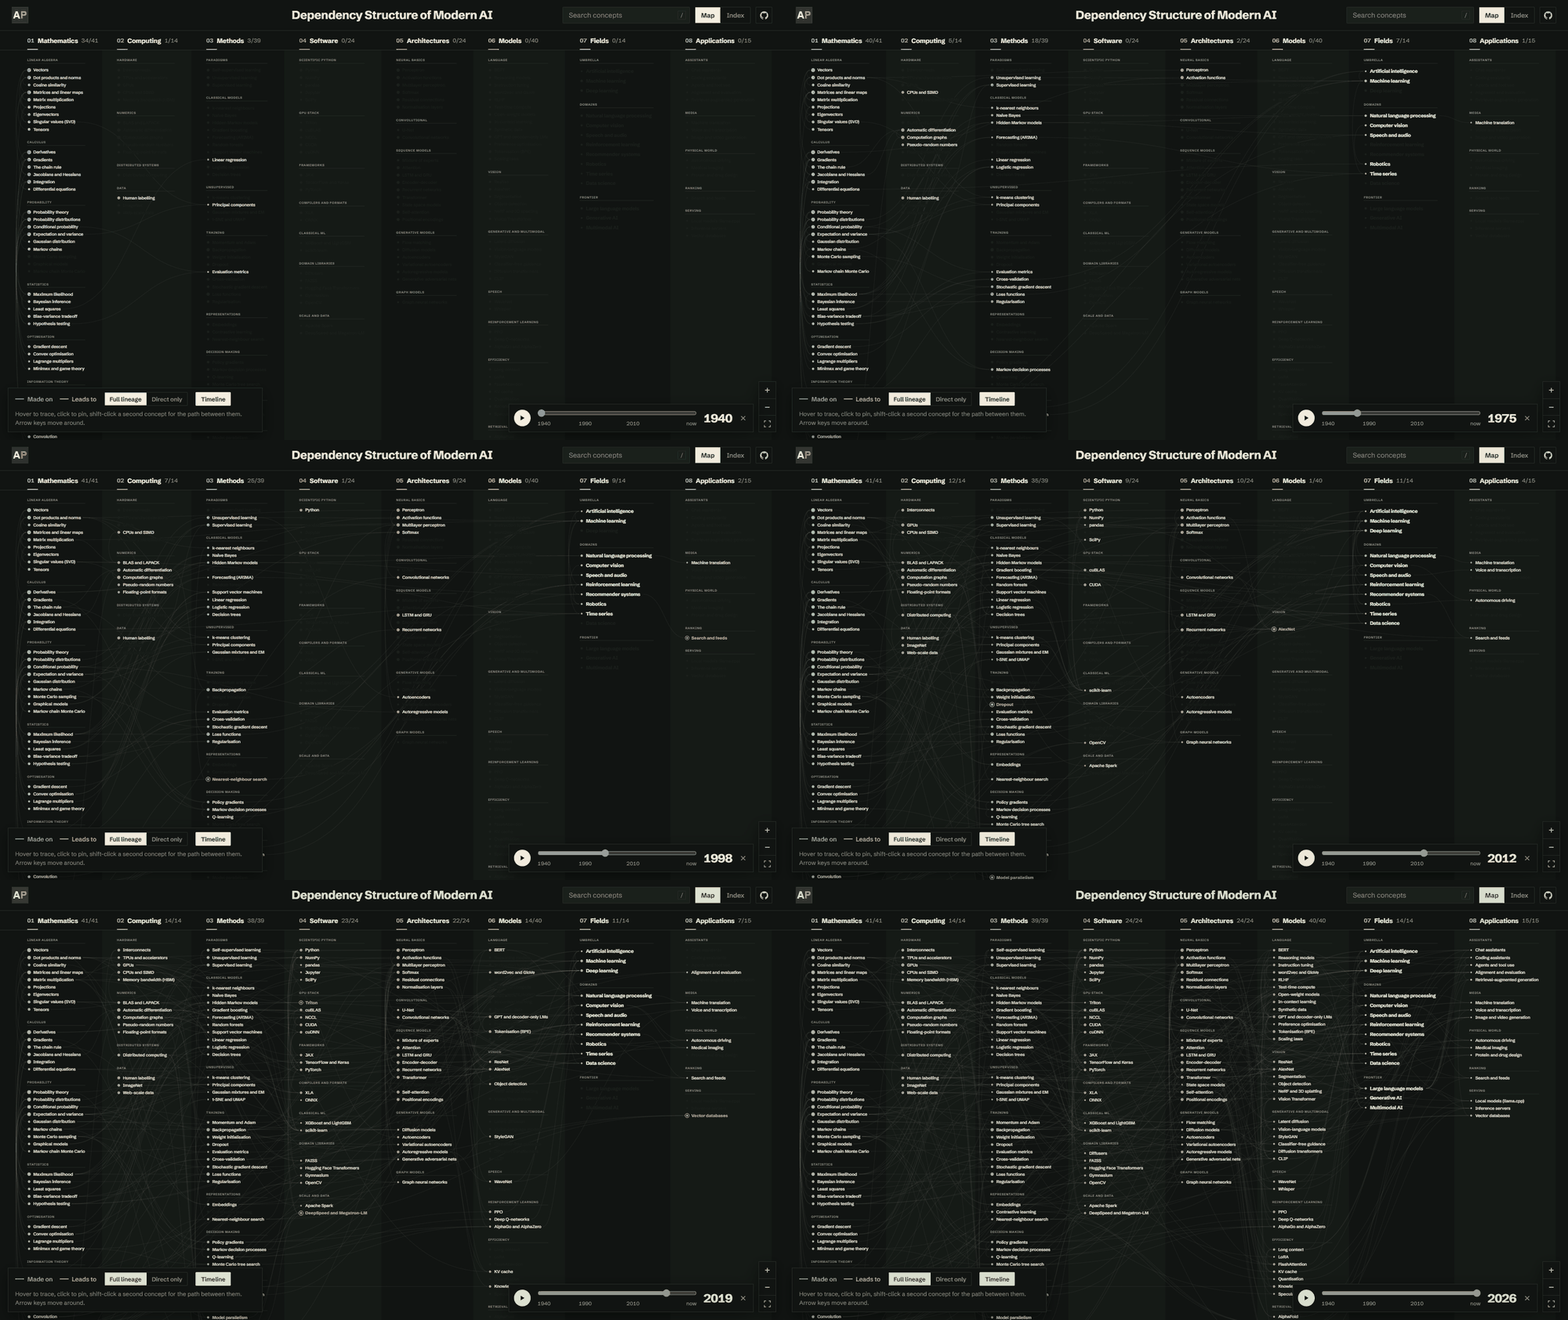
The timeline allows the graph to be explored from 1940 to the present. Concepts appear according to their associated years, with new additions lighting up as the timeline progresses. Moving to 2012, for example, brings AlexNet into view while most of the models and techniques associated with modern AI are still in the future. The years are approximate for broad ideas, and a concept without a clear date of its own appears alongside its newest dependency.
Other interactions include search across concept names, aliases and descriptions, an index view that presents every concept as readable text, keyboard navigation, and direct links to individual concepts and dependency paths. There is also an embed mode for including the interactive graph in other pages.
Making it
The implementation was considerably less involved than I initially expected.
I started with a fresh repository and gave Claude Code a prompt describing what I wanted: a deep, layered map connecting AI concepts to the mathematics, computing, software and methods underneath them. I also specified that I didn't want another generic graph of nodes and edges that looks like an Obsidian graph view. I wanted something more structured and visually considered.
Claude Opus 5.5 went ahead and built practically the entire initial application in one shot.
Most of my subsequent involvement was checking that everything actually worked, fixing visual details, identifying gaps in the conceptual coverage and adding smaller features. The project was mostly done over two days, on 8 and 9 November 2026.
The initial version contained 197 concepts. Reviewing the map exposed a few gaps. One particularly noticeable omission was data. The original structure showed the mathematical and computational foundations of AI, but didn't adequately represent the datasets and data curation involved in training these systems.
Claude also generated much of the initial concept data, including descriptions and dependencies. I reviewed the map with Claude, chose which gaps to fill, and expanded it through subsequent passes. A second review session later caught a handful of factual errors in the descriptions, which were corrected before publishing.
I added a Data group under Computing, alongside several missing foundational concepts and more recent developments such as open-weight models, test-time compute, synthetic data and interpretability. Some missing classics, including graphical models, MCMC and time series, also made their way into the map.
The concept data lives in its own file, separate from the application code, so corrections and suggestions are welcome through GitHub issues.
The application itself is plain HTML, CSS and JavaScript. There is no framework, build step or external runtime dependency. GitHub Pages serves the repository directly.
The graph layout uses barycentre ordering, an idea from layered graph drawing, to reduce crossing lines between columns. Mathematics and Fields retain manually specified reading orders. Concepts that many others build on are drawn with larger dots, making foundational concepts more visually prominent.
I also wanted the interface to fit the rest of my website, so I carried over a similar visual theme.
The code is licensed under MIT, while the concept data, including descriptions, years and dependencies, is licensed under CC BY 4.0. The repository also includes a citation file for referencing the project.
What is next
There are still plenty of concepts to add and relationships to revisit. The structure itself can also be extended with features that make the graph more useful as a learning tool.
One feature I'm considering is being able to take any concept and turn its foundations into an ordered study list. That would make it a little easier to go from exploring a dependency graph to getting a study checklist.
It won't be difficult to build with Claude Code, but I don't want to keep littering the project with features just because they're easy to implement. I'll add it if it proves useful or if somebody asks for it.
I also expect to use the map as a reference for other projects in future.
For now, DSMAI is a way to explore how different parts of modern AI fit together, understand what particular ideas build upon, and find connections that are otherwise easy to miss. It's useful to me.